clear all
use https://sscc.wisc.edu/sscc/pubs/real_world_tables/reg58 IV Regression
This example has two outcomes and three model specifications, but this time you want the outcomes to be rows rather than columns. Also, the models are two-stage least squares instrumental variables models, and you want to include a statistic from the first stage. But with the the tools you are now familiar with, this is all very easy.
8.1 Setting Up
Load the data with:
Take a moment to look it over and identify the variable names.
8.2 Run the Regressions and Collect the Results
There are two outcomes of interest: months (months until program exit) and reun (reunification within twelve months). Again, reun is an indicator variable but you’ll use a linear probability model. The predictors mgrco (mother-to-government cost-recovery order) and fgrco (father-to-government cost-recovery order) are instrumented by x1 and x2. The three models regress the outcome on just mgrco, just fgrco, and both. There’s no need to number all the models sequentially this time, so the three specifications can just be model 1, 2, and 3.
foreach outcome in months reun {
    quietly: collect, tag(outcome[`outcome'] model[(1)]): ivreg2 `outcome' (mgcro = x1 x2), robust
    quietly: collect, tag(outcome[`outcome'] model[(2)]): ivreg2 `outcome' (fgcro = x1 x2), robust
    quietly: collect, tag(outcome[`outcome'] model[(3)]): ivreg2 `outcome' (mgcro fgcro = x1 x2), robust
}
This time the outcome will be super rows rather than super columns, but the rest of the row structure is the familiar combination of colname and result.
To add the number of observations and the first-stage F statistic to this structure, give them appropriate colname tags. Number of observation is result[N] as usual. ivreg2 stores what it calls the “Weak identification test (Cragg-Donald Wald F statistic)” as result[cdf], but it really is just the F statistic from the first stage regression.
collect addtag colname[f], fortags(result[cdf])
collect addtag colname[obs], fortags(result[N])
(6 items changed in collection default)
(6 items changed in collection default)The desire layout is then:
collect layout (outcome#(colname[mgcro fgcro obs f]#result[_r_b _r_se cdf N])) (model)
Collection: default
      Rows: outcome#(colname[mgcro fgcro obs f]#result[_r_b _r_se cdf N])
   Columns: model
   Table 1: 22 x 3

-------------------------------------------------------------------------
                                           |      (1)       (2)       (3)
-------------------------------------------+-----------------------------
months                                     |
  Mother-to-government cost-recovery order |
    Coefficient                            | 1.864576            .6440803
    Std. error                             | .6677744            .6739507
  Father-to-government cost-recovery order |
    Coefficient                            |          -1.711256 -1.518115
    Std. error                             |           .3822057  .4039043
  obs                                      |
    N                                      |     1000      1000      1000
  f                                        |
    cdf                                    | 6.289266  17.21998  4.278365
reun                                       |
  Mother-to-government cost-recovery order |
    Coefficient                            | .7352069            .6219171
    Std. error                             | .2832279            .3045064
  Father-to-government cost-recovery order |
    Coefficient                            |          -.3274112 -.1409156
    Std. error                             |           .1669366  .1903597
  obs                                      |
    N                                      |     1000      1000      1000
  f                                        |
    cdf                                    | 6.289266  17.21998  4.278365
-------------------------------------------------------------------------
8.3 Clean Up
The steps to clean up this table will be familiar. Remove the base levels and the level labels on result, stacking them with no binder. Label the levels of outcome and the f and obs levels of colname.
collect style showbase off
collect style header result, level(hide)
collect style row stack, nobinder

collect label levels outcome months "Panel A. Months to foster care exit among those who exited care" reun "Panel B. Reunification within 12 months"
collect label levels colname f "First-stage F-statistic" obs "Observations"


collect preview
----------------------------------------------------------------------------------------------
                                                                |      (1)       (2)       (3)
----------------------------------------------------------------+-----------------------------
Panel A. Months to foster care exit among those who exited care |
  Mother-to-government cost-recovery order                      | 1.864576            .6440803
                                                                | .6677744            .6739507
  Father-to-government cost-recovery order                      |          -1.711256 -1.518115
                                                                |           .3822057  .4039043
  Observations                                                  |     1000      1000      1000
  First-stage F-statistic                                       | 6.289266  17.21998  4.278365
Panel B. Reunification within 12 months                         |
  Mother-to-government cost-recovery order                      | .7352069            .6219171
                                                                | .2832279            .3045064
  Father-to-government cost-recovery order                      |          -.3274112 -.1409156
                                                                |           .1669366  .1903597
  Observations                                                  |     1000      1000      1000
  First-stage F-statistic                                       | 6.289266  17.21998  4.278365
----------------------------------------------------------------------------------------------
Put parentheses around the standard errors and apply appropriate numeric formats. Add significance stars.
collect style cell result[_r_se], sformat("(%s)")
collect style cell, nformat(%8.2f)
collect style cell colname[obs], nformat(%8.0f)

collect stars _r_p .001 "***" .01 "**" .05 "*" .1 "+", attach(_r_b)

collect preview
------------------------------------------------------------------------------------------
                                                                |    (1)      (2)      (3)
----------------------------------------------------------------+-------------------------
Panel A. Months to foster care exit among those who exited care |
  Mother-to-government cost-recovery order                      | 1.86**              0.64
                                                                | (0.67)            (0.67)
  Father-to-government cost-recovery order                      |        -1.71*** -1.52***
                                                                |          (0.38)   (0.40)
  Observations                                                  |   1000     1000     1000
  First-stage F-statistic                                       |   6.29    17.22     4.28
Panel B. Reunification within 12 months                         |
  Mother-to-government cost-recovery order                      | 0.74**             0.62*
                                                                | (0.28)            (0.30)
  Father-to-government cost-recovery order                      |          -0.33*    -0.14
                                                                |          (0.17)   (0.19)
  Observations                                                  |   1000     1000     1000
  First-stage F-statistic                                       |   6.29    17.22     4.28
------------------------------------------------------------------------------------------
Add a title, and notes, and remove the right border on the row headers.
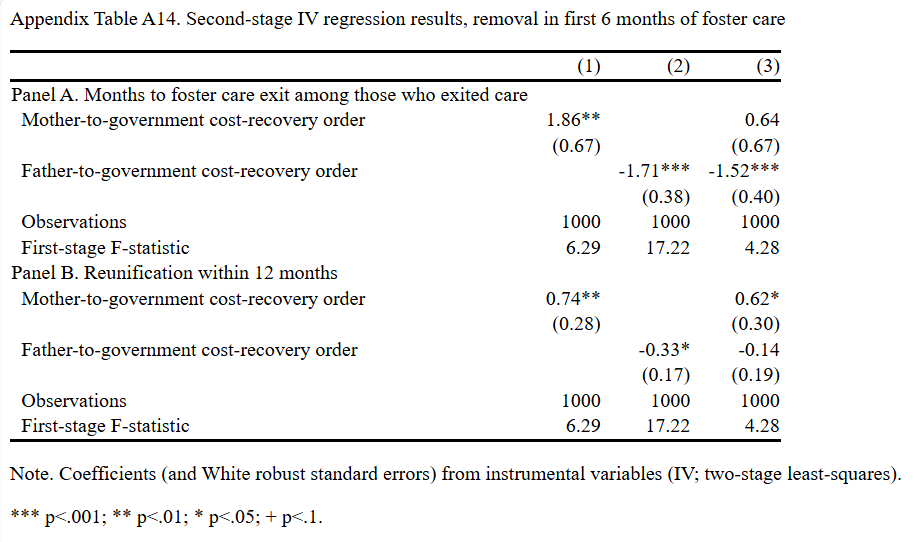
collect title "Appendix Table A14. Second-stage IV regression results, removal in first 6 months of foster care"
collect note "Note. Coefficients (and White robust standard errors) from instrumental variables (IV; two-stage least-squares)."
collect note "*** p<.001; ** p<.01; * p<.05; + p<.1."

collect style cell border_block, border(right, pattern(nil))

collect preview
Appendix Table A14. Second-stage IV regression results, removal in first 6 months of foster care
----------------------------------------------------------------------------------------
                                                                   (1)      (2)      (3)
----------------------------------------------------------------------------------------
Panel A. Months to foster care exit among those who exited care
  Mother-to-government cost-recovery order                      1.86**              0.64
                                                                (0.67)            (0.67)
  Father-to-government cost-recovery order                             -1.71*** -1.52***
                                                                         (0.38)   (0.40)
  Observations                                                    1000     1000     1000
  First-stage F-statistic                                         6.29    17.22     4.28
Panel B. Reunification within 12 months
  Mother-to-government cost-recovery order                      0.74**             0.62*
                                                                (0.28)            (0.30)
  Father-to-government cost-recovery order                               -0.33*    -0.14
                                                                         (0.17)   (0.19)
  Observations                                                    1000     1000     1000
  First-stage F-statistic                                         6.29    17.22     4.28
----------------------------------------------------------------------------------------
Note. Coefficients (and White robust standard errors) from instrumental variables (IV; two-stage least-squares).
*** p<.001; ** p<.01; * p<.05; + p<.1.
All done!