clear all
use https://sscc.wisc.edu/sscc/pubs/real_world_tables/reg47 More Hierarchical Models
This model again has multiple outcomes and a hierarchy within them, with the twist that one of the outcomes skips that second level of hierarchy. So partially because of that and partially to teach you something new, we’ll make it in a different way.
7.1 Setting Up
Load the data with:
Take a moment to look it over and identify the variable names.
7.2 Run the Models and Collect the Results
This time we have five outcomes of interest:
exit: time to exit the programreun_12: indicator for reunification with parent within 12 monthsreun_24: indicator for reunification with parent within 24 monthsterm_12: indicator for termination of parental rights within 12 monthsterm_24: indicator for termination of parental rights within 24 months
For better or worse we’ll use linear probability models, so the model is the same for all five outcomes.
We’ll add a level of hierarchy that denotes reunification outcomes (reun_12 and reun_24) as opposed to termination outcomes (term_12 and term_24). But exit does not fall in either category.
Begin by running the five models and collecting the results, tagging each with the outcome used:
foreach y of varlist exit reun* term* {
    quietly: collect, tag(model[`y']): reg `y' i.race child_age, robust
}
The starting table layout can be very standard:
collect layout (colname#result[_r_b _r_se]) (model)
Collection: default
      Rows: colname#result[_r_b _r_se]
   Columns: model
   Table 1: 15 x 5

---------------------------------------------------------------
              |      exit  reun_12  reun_24   term_12   term_24
--------------+------------------------------------------------
race=0        |
  Coefficient |         0        0        0         0         0
  Std. error  |         0        0        0         0         0
race=1        |
  Coefficient | -.5628894  .018659  .036942  .0086319  .0088953
  Std. error  |   .120938 .0122062 .0121968  .0122097  .0122086
race=2        |
  Coefficient | -1.182291 .0031157  .022221  .0187913 -.0219267
  Std. error  |  .1224544 .0123174 .0123133  .0123151  .0123132
child_age     |
  Coefficient | -.1303925 .0011333 .0006035 -.0002348 -.0006604
  Std. error  |  .0101925 .0010253 .0010241  .0010253  .0010254
Intercept     |
  Coefficient |  11.89179 .4904592 .4919842  .4929565  .5072619
  Std. error  |   .118316 .0119706 .0119638  .0119693  .0119707
---------------------------------------------------------------
7.3 Add New Structure
To define the hierarchy of models, add new tags to the collection for a dimension called outcome, with the levels Reunification and Termination. Target them based on the levels of model.
collect addtag outcome[Reunification], fortags(model[reun_12 reun_24])
collect addtag outcome[Termination], fortags(model[term_12 term_24])
(126 items changed in collection default)
(126 items changed in collection default)You could add result[N] to the row structure without interacting it with colname, but that will cause headaches down the road. Instead, assign it a colname level so it fits the existing structure.
collect addtag colname[obs], fortags(result[N])(5 items changed in collection default)Now update the layout accordingly. You don’t want the intercept and want the number of observations last, so specify colname[i.race child_age obs] in the rows. Add N to the levels of result.
For the columns, most of the models and their hierarchy will be specified by outcome#model. But model[exit] doesn’t have a level for outcome and stands on its own.
collect layout (colname[i.race child_age obs]#result[_r_b _r_se N]) (model[exit] outcome#model)
Collection: default
      Rows: colname[i.race child_age obs]#result[_r_b _r_se N]
   Columns: model[exit] outcome#model
   Table 1: 14 x 5

----------------------------------------------------------------------------------------
                         |      exit Reunification Reunification Termination Termination
                         |                 reun_12       reun_24     term_12     term_24
-------------------------+--------------------------------------------------------------
race=0                   |
  Coefficient            |         0             0             0           0           0
  Std. error             |         0             0             0           0           0
race=1                   |
  Coefficient            | -.5628894       .018659       .036942    .0086319    .0088953
  Std. error             |   .120938      .0122062      .0121968    .0122097    .0122086
race=2                   |
  Coefficient            | -1.182291      .0031157       .022221    .0187913   -.0219267
  Std. error             |  .1224544      .0123174      .0123133    .0123151    .0123132
child_age                |
  Coefficient            | -.1303925      .0011333      .0006035   -.0002348   -.0006604
  Std. error             |  .0101925      .0010253      .0010241    .0010253    .0010254
obs                      |
  Number of observations |     10000         10000         10000       10000       10000
----------------------------------------------------------------------------------------
7.4 Clean Up
This is the table you want, and now you just need to clean up its appearance. In the past we’ve dealt with some of the obvious issues by using the style table-reg3, but this time we’ll do them ourselves so you’ll know how. (table-reg3 won’t always be a good fit for your table.)
When column headers are repeated (duplicated), you want them to be combined and then centered. Do so with:
collect style column, dups(center)
collect preview
--------------------------------------------------------------------------
                         |      exit   Reunification       Termination
                         |            reun_12  reun_24   term_12   term_24
-------------------------+------------------------------------------------
race=0                   |
  Coefficient            |         0        0        0         0         0
  Std. error             |         0        0        0         0         0
race=1                   |
  Coefficient            | -.5628894  .018659  .036942  .0086319  .0088953
  Std. error             |   .120938 .0122062 .0121968  .0122097  .0122086
race=2                   |
  Coefficient            | -1.182291 .0031157  .022221  .0187913 -.0219267
  Std. error             |  .1224544 .0123174 .0123133  .0123151  .0123132
child_age                |
  Coefficient            | -.1303925 .0011333 .0006035 -.0002348 -.0006604
  Std. error             |  .0101925 .0010253 .0010241  .0010253  .0010254
obs                      |
  Number of observations |     10000    10000    10000     10000     10000
--------------------------------------------------------------------------
Next clean up the row headers. Begin by turning off the base categories:
collect style showbase offThen turn off the labels for the levels of result:
collect style header result, level(hide)
collect preview
-----------------------------------------------------------
          |      exit   Reunification       Termination
          |            reun_12  reun_24   term_12   term_24
----------+------------------------------------------------
race=1    | -.5628894  .018659  .036942  .0086319  .0088953
          |   .120938 .0122062 .0121968  .0122097  .0122086
race=2    | -1.182291 .0031157  .022221  .0187913 -.0219267
          |  .1224544 .0123174 .0123133  .0123151  .0123132
child_age | -.1303925 .0011333 .0006035 -.0002348 -.0006604
          |  .0101925 .0010253 .0010241  .0010253  .0010254
obs       |     10000    10000    10000     10000     10000
-----------------------------------------------------------
Now stack the levels of the indicator variables, removing the “binder” (race=)
collect style row stack, nobinder
collect preview
-----------------------------------------------------------
          |      exit   Reunification       Termination
          |            reun_12  reun_24   term_12   term_24
----------+------------------------------------------------
race      |
  1       | -.5628894  .018659  .036942  .0086319  .0088953
          |   .120938 .0122062 .0121968  .0122097  .0122086
  2       | -1.182291 .0031157  .022221  .0187913 -.0219267
          |  .1224544 .0123174 .0123133  .0123151  .0123132
child_age | -.1303925 .0011333 .0006035 -.0002348 -.0006604
          |  .0101925 .0010253 .0010241  .0010253  .0010254
obs       |     10000    10000    10000     10000     10000
-----------------------------------------------------------
Next up is the content of the table. Change the numeric format for everything to two decimal places, and then change result[N] to zero decimal places and commas. Put parentheses around the standard errors, and add stars for significance.
collect style cell, nformat(%8.2f)
collect style cell colname[obs], nformat(%8.0fc)
collect style cell result[_r_se], sformat("(%s)")
collect stars _r_p .001 "***" .01 "**" .05 "*" .1 "+", attach(_r_b)

collect preview
----------------------------------------------------
          |     exit  Reunification    Termination
          |          reun_12 reun_24 term_12 term_24
----------+-----------------------------------------
race      |
  1       | -0.56***    0.02  0.04**    0.01    0.01
          |   (0.12)  (0.01)  (0.01)  (0.01)  (0.01)
  2       | -1.18***    0.00   0.02+    0.02  -0.02+
          |   (0.12)  (0.01)  (0.01)  (0.01)  (0.01)
child_age | -0.13***    0.00    0.00   -0.00   -0.00
          |   (0.01)  (0.00)  (0.00)  (0.00)  (0.00)
obs       |   10,000  10,000  10,000  10,000  10,000
----------------------------------------------------
Next set labels for the headers. In creating the outcome dimension you deliberately used pretty names for the levels (“Reunification” and “Termination”) so they don’t need labels, but exit does. I also deliberately did not put pretty variable and value labels in the data set so you could practice setting them in the table. While you’re at it, set a title and some notes.
collect label levels model exit "Exit", modify
collect label levels colname race "Race" child_age "Child Age" obs "Observations", modify
collect label levels race 0 "White" 1 "Black" 2 "Hispanic", modify
collect label levels model reun_12 "Within 12 Months" reun_24 "Within 24 Months" term_12 "Within 12 Months" term_24 "Within 24 Months"

collect title "Appendix Table A3. OLS regression results, associations of family characteristics with foster care outcomes "
collect note "Note. Coefficients from OLS regressions with White robust standard errors."
collect note "*** p<.001; ** p<.01; * p<.05; + p<.1."

collect preview
Appendix Table A3. OLS regression results, associations of family characteristics with foster care outcomes
-------------------------------------------------------------------------------------------
| Exit Reunification Termination
| Within 12 Months Within 24 Months Within 12 Months Within 24 Months
-------------+-----------------------------------------------------------------------------
Race |
Black | -0.56*** 0.02 0.04** 0.01 0.01
| (0.12) (0.01) (0.01) (0.01) (0.01)
Hispanic | -1.18*** 0.00 0.02+ 0.02 -0.02+
| (0.12) (0.01) (0.01) (0.01) (0.01)
Child Age | -0.13*** 0.00 0.00 -0.00 -0.00
| (0.01) (0.00) (0.00) (0.00) (0.00)
Observations | 10,000 10,000 10,000 10,000 10,000
-------------------------------------------------------------------------------------------
Note. Coefficients from OLS regressions with White robust standard errors.
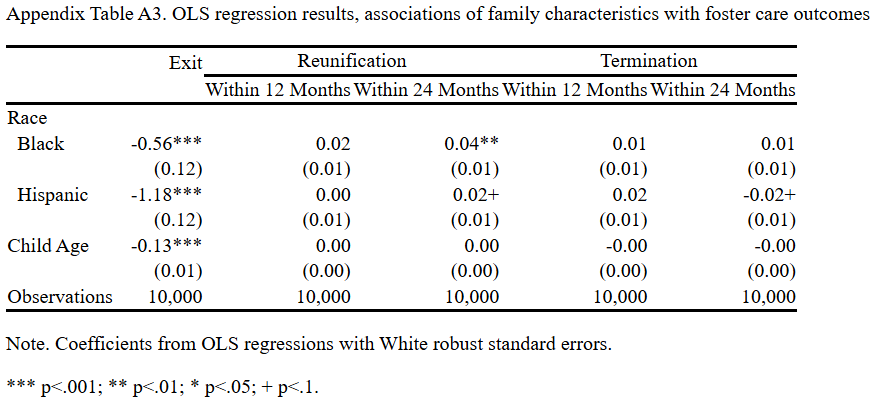
*** p<.001; ** p<.01; * p<.05; + p<.1.Finally, eliminate the right border, add a bottom border under the outcome header, and remove it from the body of the table.
collect style cell border_block, border(right, pattern(nil))
collect style cell outcome, border(bottom)
collect style cell colname[i.race child_age], border(bottom, pattern(nil))
collect preview
Appendix Table A3. OLS regression results, associations of family characteristics with foster care outcomes
-----------------------------------------------------------------------------------------
                 Exit           Reunification                      Termination
                      -------------------------------------------------------------------
                      Within 12 Months Within 24 Months Within 12 Months Within 24 Months
-----------------------------------------------------------------------------------------
Race
  Black      -0.56***             0.02           0.04**             0.01             0.01
               (0.12)           (0.01)           (0.01)           (0.01)           (0.01)
  Hispanic   -1.18***             0.00            0.02+             0.02           -0.02+
               (0.12)           (0.01)           (0.01)           (0.01)           (0.01)
Child Age    -0.13***             0.00             0.00            -0.00            -0.00
               (0.01)           (0.00)           (0.00)           (0.00)           (0.00)
Observations   10,000           10,000           10,000           10,000           10,000
-----------------------------------------------------------------------------------------
Note. Coefficients from OLS regressions with White robust standard errors.
*** p<.001; ** p<.01; * p<.05; + p<.1.