clear all
use https://sscc.wisc.edu/sscc/pubs/real_world_tables/reg36 Hierarchies of Models
In this example, we have a large number of models in a hierarchical structure: outcome, birth weight, and two model specifications. This is straightforward if you think through the tags required.
6.1 Setting Up
Load the data with:
Take a moment to look it over and identify the variable names.
6.2 Run the Models and Collect the Results
Running all the models will be a job for loops. First a loop over the two outcomes (mort6 and mort364) and then a loop over the two birthweight subsamples (if low==0 and if low==1). Then two different models, one without controls and one with (employed will stand in for all the controls). Rather than creating a tag for controls, you’ll create a result level called controls that contains either “Y” or “N”. But you also want to number all the models sequentially, so create a counter i that is incremented after each model.
Call the dimensions to be created outcome, wt, and model. The levels of outcome and wt will be the current values of the macros created by the loops (for example, outcome[`outcome']) and the level of model will be `i'.
Putting this all together:
local model 1
foreach outcome in mort6 mort364 {
    foreach low in 0 1 {
        quietly: collect, tag(outcome[`outcome'] wt[`low'] model[`model']): reg `outcome' nets nicu if low==`low', robust
        collect get controls = "N", tag(outcome[`outcome'] wt[`low'] model[`model'])
        local model = `model' + 1
        quietly: collect, tag(outcome[`outcome'] wt[`low'] controls[Y] model[`model']): reg `outcome' nets nicu employed if low==`low', robust
        collect get controls = "Y", tag(outcome[`outcome'] wt[`low'] model[`model'])
        local model = `model' + 1
    }
}
Now think about the table layout. For rows, you want just nicu and nets from colname, interacted with _r_b and _r_se from result. Then add result[controls N] for the controls row and the observation numbers.
For the columns, outcome is the top level, then wt, then model.
collect layout (colname[nicu nets]#result[_r_b _r_se] result[controls N]) (outcome#wt#model)
Collection: default
      Rows: colname[nicu nets]#result[_r_b _r_se] result[controls N]
   Columns: outcome#wt#model
   Table 1: 8 x 8

------------------------------------------------------------------------------------------------
                       |    mort6    mort6    mort6    mort6  mort364  mort364  mort364  mort364
                       |        0        0        1        1        0        0        1        1
                       |        1        2        3        4        5        6        7        8
-----------------------+------------------------------------------------------------------------
nicu                   |
  Coefficient          | .1017549 .1017661 .1258163 .1258681 .1001331  .100117 .1522515 .1523971
  Std. error           | .0119408 .0119413 .0172121 .0172166 .0100596 .0100595 .0174978 .0174984
nets                   |
  Coefficient          | .0353459  .035364 .0464465 .0464054 .0464274 .0464015  .052608 .0524925
  Std. error           | .0119412 .0119418 .0171607 .0171645 .0100661 .0100655 .0175333  .017535
controls               |        N        Y        N        Y        N        Y        N        Y
Number of observations |     6922     6922     3078     3078     6922     6922     3078     3078
------------------------------------------------------------------------------------------------
Obviously the appearance needs some work, but this is the table you want.
6.3 Clean Up
The header settings you want can mostly be gotten from the table-reg3 stye.
collect style use table-reg3
collect preview
Collection: default
      Rows: colname[nicu nets]#result[_r_b _r_se] result[controls N]
   Columns: outcome#wt#model
   Table 1: 9 x 8

---------------------------------------------------------------------------------------------
     |                    mort6                                      mort364
     |           0                     1                     0                     1
     |         1          2          3          4          5          6          7          8
-----+---------------------------------------------------------------------------------------
nicu |  .1017549   .1017661   .1258163   .1258681   .1001331    .100117   .1522515   .1523971
     |  .0119408   .0119413   .0172121   .0172166   .0100596   .0100595   .0174978   .0174984
     |
nets |  .0353459    .035364   .0464465   .0464054   .0464274   .0464015    .052608   .0524925
     |  .0119412   .0119418   .0171607   .0171645   .0100661   .0100655   .0175333    .017535
     |
     |         N          Y          N          Y          N          Y          N          Y
     |
     |      6922       6922       3078       3078       6922       6922       3078       3078
---------------------------------------------------------------------------------------------
Removing the level labels from result is good for _r_b and _r_se, but you want them for controls and N.
collect label levels result controls "Controls" N "Number of Observations", modify
collect style header result[controls N], level(label)
collect preview
---------------------------------------------------------------------------------------------------------------
                       |                    mort6                                      mort364
                       |           0                     1                     0                     1
                       |         1          2          3          4          5          6          7          8
-----------------------+---------------------------------------------------------------------------------------
nicu                   |  .1017549   .1017661   .1258163   .1258681   .1001331    .100117   .1522515   .1523971
                       |  .0119408   .0119413   .0172121   .0172166   .0100596   .0100595   .0174978   .0174984
                       |
nets                   |  .0353459    .035364   .0464465   .0464054   .0464274   .0464015    .052608   .0524925
                       |  .0119412   .0119418   .0171607   .0171645   .0100661   .0100655   .0175333    .017535
                       |
Controls               |         N          Y          N          Y          N          Y          N          Y
                       |
Number of Observations |      6922       6922       3078       3078       6922       6922       3078       3078
---------------------------------------------------------------------------------------------------------------
The column headers also need labels. The table needs a title and some notes.
collect label levels colname nicu "Nearest obstetrics in NICU City" nets "Nearest obstetrics in NETS City"
collect label levels outcome mort6 "Mortality 0-6 Days" mort364 "Mortality 0-364 Days"
collect label levels wt 0 "<2500g" 1 ">=2500g"

collect title "Table 3: Effect of the NICU and NETS on mortality"
collect note "Robust standard errors in paretheses"
collect note "*** p<.001; ** p<.01; * p<.05; + p<.1."

collect preview
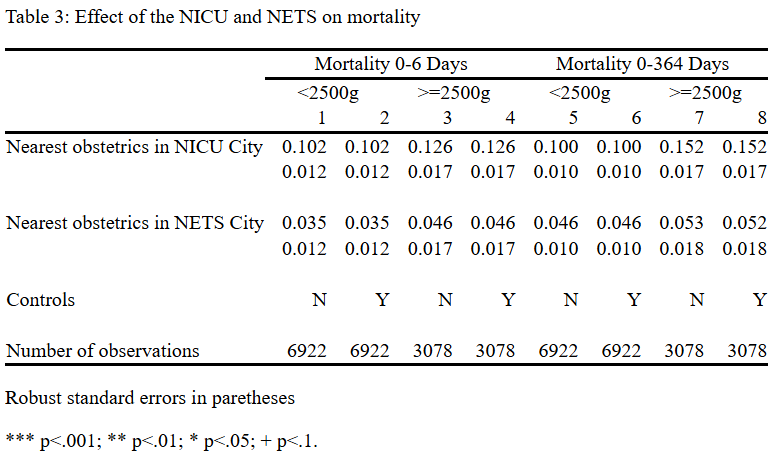
Table 3: Effect of the NICU and NETS on mortality
------------------------------------------------------------------------------------------------------------------------
                                |              Mortality 0-6 Days                         Mortality 0-364 Days
                                |         <2500g               >=2500g                <2500g               >=2500g
                                |         1          2          3          4          5          6          7          8
--------------------------------+---------------------------------------------------------------------------------------
Nearest obstetrics in NICU City |  .1017549   .1017661   .1258163   .1258681   .1001331    .100117   .1522515   .1523971
                                |  .0119408   .0119413   .0172121   .0172166   .0100596   .0100595   .0174978   .0174984
                                |
Nearest obstetrics in NETS City |  .0353459    .035364   .0464465   .0464054   .0464274   .0464015    .052608   .0524925
                                |  .0119412   .0119418   .0171607   .0171645   .0100661   .0100655   .0175333    .017535
                                |
Controls                        |         N          Y          N          Y          N          Y          N          Y
                                |
Number of Observations          |      6922       6922       3078       3078       6922       6922       3078       3078
------------------------------------------------------------------------------------------------------------------------
Robust standard errors in paretheses
*** p<.001; ** p<.01; * p<.05; + p<.1.
You also don’t need so many digits. The easy way is to format everything with three digits, and then override that with zero for the number of observations.
collect style cell, nformat(%8.3f)
collect style cell result[N], nformat(%8.0f)
collect preview
Table 3: Effect of the NICU and NETS on mortality
------------------------------------------------------------------------------------------------
                                |        Mortality 0-6 Days             Mortality 0-364 Days
                                |      <2500g         >=2500g          <2500g         >=2500g
                                |      1       2       3       4       5       6       7       8
--------------------------------+---------------------------------------------------------------
Nearest obstetrics in NICU City |  0.102   0.102   0.126   0.126   0.100   0.100   0.152   0.152
                                |  0.012   0.012   0.017   0.017   0.010   0.010   0.017   0.017
                                |
Nearest obstetrics in NETS City |  0.035   0.035   0.046   0.046   0.046   0.046   0.053   0.052
                                |  0.012   0.012   0.017   0.017   0.010   0.010   0.018   0.018
                                |
Controls                        |      N       Y       N       Y       N       Y       N       Y
                                |
Number of Observations          |   6922    6922    3078    3078    6922    6922    3078    3078
------------------------------------------------------------------------------------------------
Robust standard errors in paretheses
*** p<.001; ** p<.01; * p<.05; + p<.1.
Now consider the borders. You can eliminate the border between the row headers and the rest of the table by eliminating right borders:
collect style cell border_block, border(right, pattern(nil))To add an underline to the outcome headers, use the cell_type dimension to target them specifically.
collect levelsof cell_type
Collection: default
 Dimension: cell_type
    Levels: column-header corner item row-header
Thus you want items tagged with cell_type[column-header] and outcome.
collect style cell cell_type[column-header]#outcome, border(bottom, pattern(solid))
collect preview
Table 3: Effect of the NICU and NETS on mortality
----------------------------------------------------------------------------------------------
                                       Mortality 0-6 Days             Mortality 0-364 Days
                                --------------------------------------------------------------
                                     <2500g         >=2500g          <2500g         >=2500g
                                --------------------------------------------------------------
                                     1       2       3       4       5       6       7       8
----------------------------------------------------------------------------------------------
Nearest obstetrics in NICU City  0.102   0.102   0.126   0.126   0.100   0.100   0.152   0.152
                                 0.012   0.012   0.017   0.017   0.010   0.010   0.017   0.017

Nearest obstetrics in NETS City  0.035   0.035   0.046   0.046   0.046   0.046   0.053   0.052
                                 0.012   0.012   0.017   0.017   0.010   0.010   0.018   0.018

Controls                             N       Y       N       Y       N       Y       N       Y

Number of Observations            6922    6922    3078    3078    6922    6922    3078    3078
----------------------------------------------------------------------------------------------
Robust standard errors in paretheses
*** p<.001; ** p<.01; * p<.05; + p<.1.
Unfortunately that also put a border under the birthweight headers. It’s easiest just remove it specifically.
collect style cell cell_type[column-header]#wt, border(bottom, pattern(nil))
collect preview
Table 3: Effect of the NICU and NETS on mortality
----------------------------------------------------------------------------------------------
                                       Mortality 0-6 Days             Mortality 0-364 Days
                                --------------------------------------------------------------
                                     <2500g         >=2500g          <2500g         >=2500g
                                     1       2       3       4       5       6       7       8
----------------------------------------------------------------------------------------------
Nearest obstetrics in NICU City  0.102   0.102   0.126   0.126   0.100   0.100   0.152   0.152
                                 0.012   0.012   0.017   0.017   0.010   0.010   0.017   0.017

Nearest obstetrics in NETS City  0.035   0.035   0.046   0.046   0.046   0.046   0.053   0.052
                                 0.012   0.012   0.017   0.017   0.010   0.010   0.018   0.018

Controls                             N       Y       N       Y       N       Y       N       Y

Number of Observations            6922    6922    3078    3078    6922    6922    3078    3078
----------------------------------------------------------------------------------------------
Robust standard errors in paretheses
*** p<.001; ** p<.01; * p<.05; + p<.1.