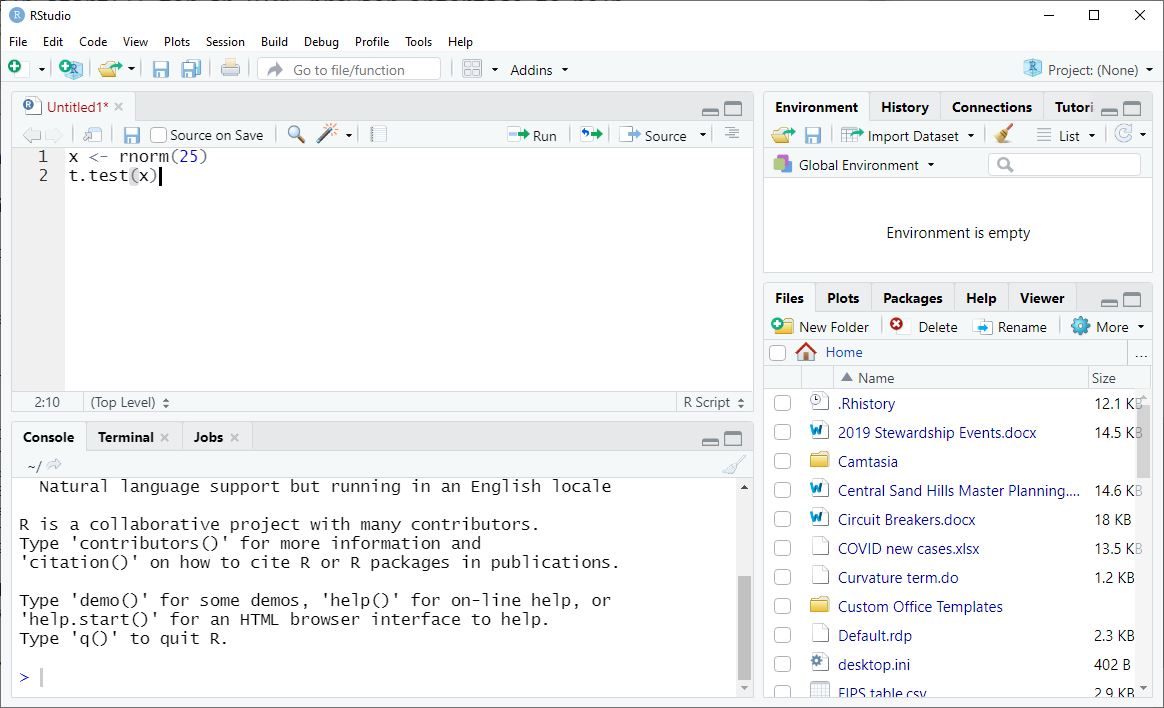
x <- rnorm(25)
t.test(x)2 Writing and Running Commands
There are two main panes in RStudio where we write and execute R commands, or R statements. We work with scripts, sequences of statements, in the script editor, and we work with individual statements in the Console.
2.1 Working with Scripts
We do most of our work in RStudio by writing, running, and saving scripts. A good script documents our work and also makes it easy to go back and correct any mistakes we may later find.
If your project takes more than three or four statements to complete, you should probably be writing a script!
2.1.1 Writing Scripts
Start a new script by going to the File menu and clicking New File - R Script. We can do the same thing by clicking the New File icon  in the toolbar.
We can open existing scripts by clicking on them in the Files pane in the lower-right corner of the RStudio workspace.
As an example, we will look at a one-sample t-test. We will simulate the data, so we know what the result should be, and then perform the test.
Type the following statements into a new script:
This generates 25 observations from a random normal distribution with mean zero and a standard deviation of one. Then we perform a one-sample t-test. The results tell us, assuming that we took a sample from a population of numbers with mean zero, the probability of observing our sample. We do not expect to reject the null hypothesis that the mean is zero (95% of the time).
2.1.2 Running Scripts
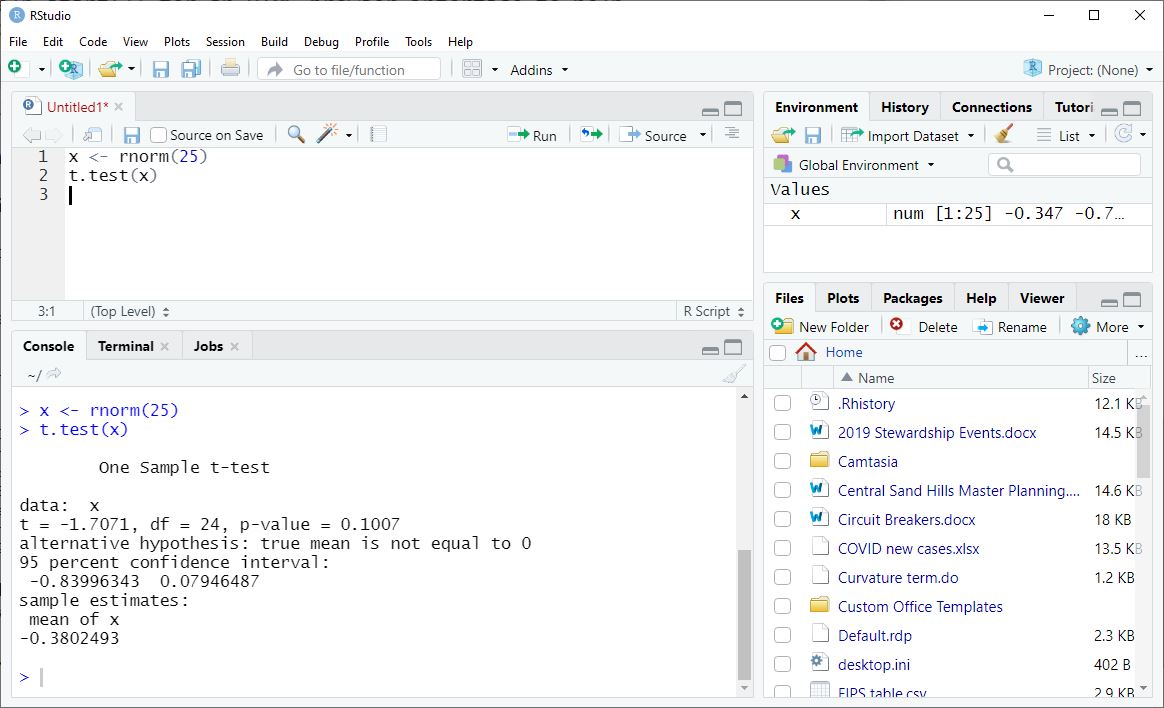
Each line in our script is a statement, a command to be run. To run these statements one at a time move your cursor anywhere in the first line and key Ctrl-Enter (or Cmd-Enter on Mac). You can also click on the Run button at the top of the script editor. Both of these actions not only run the current statement, but also move the cursor to the next statement, making it easy to walk step by step through your script.
To run more than one statement at a time, highlight all the code you want to run and then key Ctrl-Enter or click Run. Be careful: you can highlight less than a full statement, and R will try to run only exactly what you highlighted!
    One Sample t-test

data:  x
t = -0.17603, df = 24, p-value = 0.8617
alternative hypothesis: true mean is not equal to 0
95 percent confidence interval:
 -0.4241222  0.3574616
sample estimates:
 mean of x
-0.0333303
If you try this example, you will certainly get different numbers, because we are generating random data. You might even get a result where you reject the null hypothesis! Why?
Note how the first line of code, x <- rnorm(25) does not produce output in the console (instead, it creates an object, x, in our environment), while the second line, t.test(x), does produce output in the console. We will learn about the types of results that R statements create in the next chapter.
After you have written code in your script, you should save it. Save your script frequently! Click File - Save, or click on the floppy disk icon  in the toolbar. An R script’s file extension is “.R”.
2.2 Working in the Console
When we are in the midst of thinking your way through a problem, we will also find it useful to issue statements in the Console. The Console is the programmer’s scratch sheet of paper.
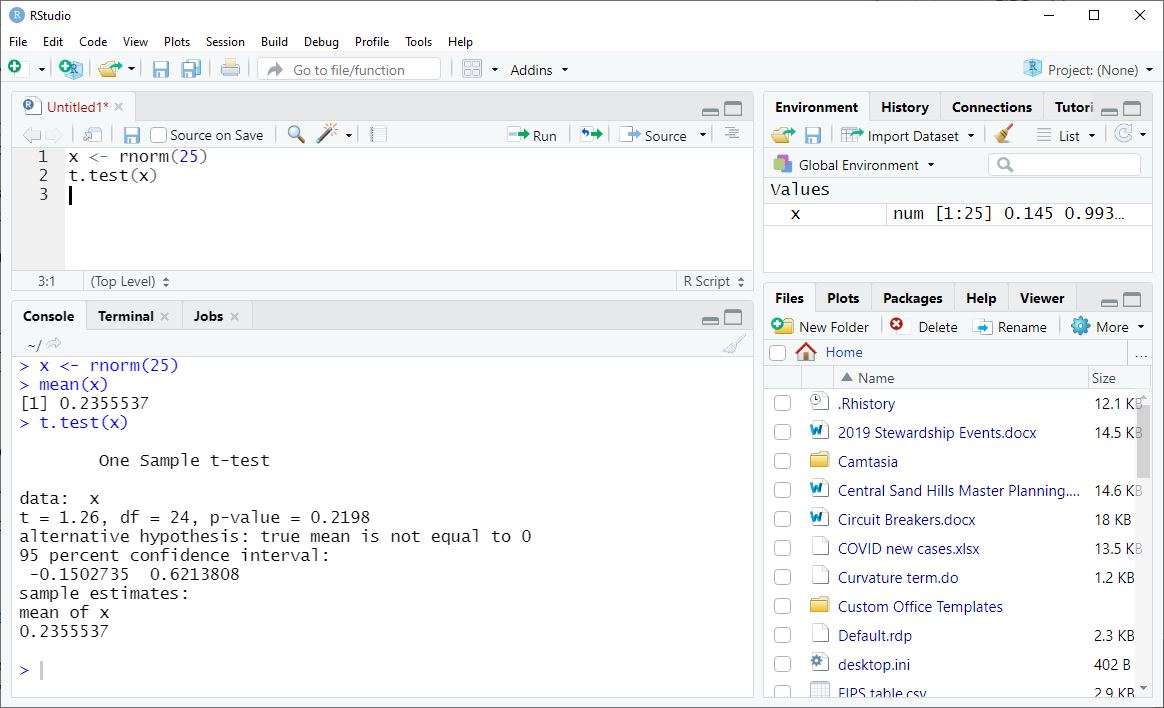
For example, suppose we have done the first step above, generating random numbers in a vector called x. As a check, we decide we would like to see the numbers generated and calculate their mean, which should be close to zero.
In the Console, at the > prompt, we type
xand see this output:
 [1] -0.56047565 -0.23017749  1.55870831  0.07050839  0.12928774  1.71506499
 [7]  0.46091621 -1.26506123 -0.68685285 -0.44566197  1.22408180  0.35981383
[13]  0.40077145  0.11068272 -0.55584113  1.78691314  0.49785048 -1.96661716
[19]  0.70135590 -0.47279141 -1.06782371 -0.21797491 -1.02600445 -0.72889123
[25] -0.62503927
The numbers look reasonable (most of the values are between -2 and 2, right?), so we follow up in the Console with mean(x), and we will see that the result is close to zero.
mean(x)[1] -0.0333303If we now follow up with the t.test() in our script, our result should be not statistically significant (a p-value larger than 0.05 in the second line of the output).
2.3 Command History
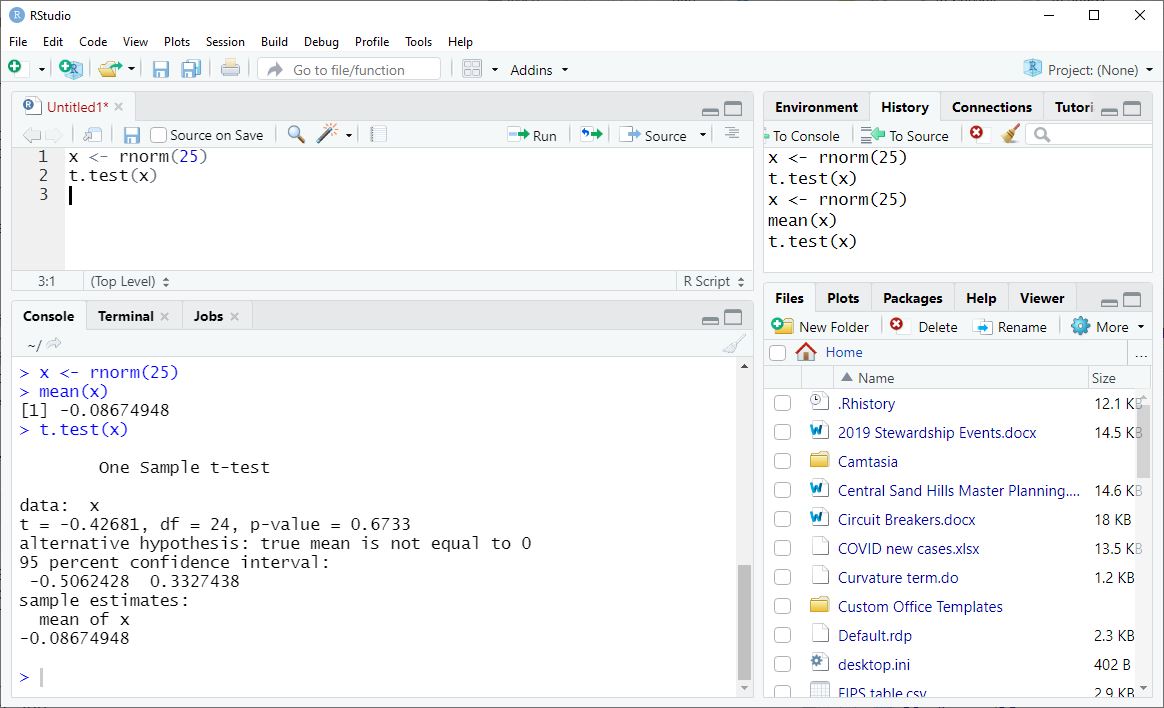
R keeps track of our command history, whether the statements were run from a script or from the Console. In the Console we can scroll through this history with the up and down arrows on our keyboard.
For example, we could use feature this to quickly generate a new sample and run a new t-test by scrolling “back” (up) and executing each command in sequence.
We can also access our command history in RStudio’s History pane (upper right, tabbed with Environment). Here we can highlight one or more statements and send them to the Console. We can also send statements “to Source” (our script), turning our scratch work into something we can save.
2.4 Exercises
Start a new script.
Type the following command into your script, which generate 10 observations from a Poisson distribution where lambda equals 2:
y <- rpois(10, lambda = 2).Add a line to your script that calculates the
mean()ofy.Run both lines of code.
In your console, enter
yto view its values.Save the script.