This article is part of the Stata for Students series. If you are new to Stata we strongly recommend reading all the articles in the Stata Basics section.
We'll talk about how to create various graphs in the statistical sections of Stata for Students, but in this article we'll discuss what to do with a graph once you've created it. The answer will depend on what your instructor asks you to turn in.
As an example, go to the U:\SFS folder you created in Managing Stata Files and create a new do file called usegraphs.do as described in Doing Your Work Using Do Files. Open it, and start with:
capture log close
log using usegraphs.log, replace
clear all
set more off
use gss_sample
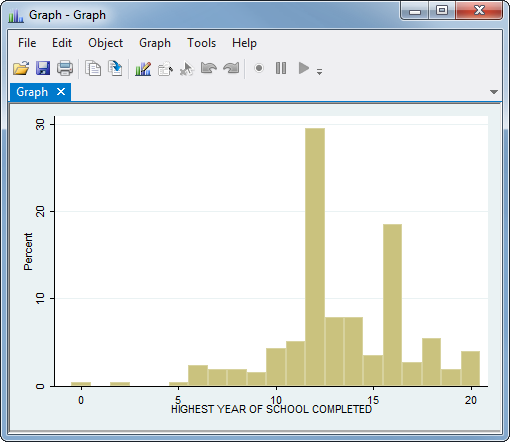
histogram educ, discrete percent
log close
This will create a histogram of the educ (years of education) variable. The options used tell Stata that educ is a discrete variable and thus the histogram should have a bin for each value, and that the y-axis should be labeled with percentages. The histogram command is discussed in Histograms.
If this were a homework assignment, your next task would be to get this graph to your instructor.
Printing a Graph
If your instructor asks you to print the graph and hand in the paper copy, click the button that looks like a printer at the top of the graph. All students can use the printers in the Van Hise InfoLab. More printing locations can be found on DoIT’s printing for students page.
Copying a Graph into a Word Document
If your instructor asks you to put your graph in a Word document, right-click on the graph and choose Copy, then open your Word document and paste it in the proper location.
Turning a Graph into a File
If you just click the save button on the graph window, the graph will be saved as a Stata .gph file but other programs won't be able to use it. You can save the graph in a variety of standard image formats using graph export:
graph export educ_hist.emf, replace
Stata will figure out what kind of file you want from the extension you put at the end of the file name. If you just want to send someone the graph itself, a .pdf file (Portable Document Format) is probably ideal. If you want to put the graph in a Word document, use .emf (Enhanced MetaFile). You can then go to Word and click Insert, Picture to add it to your document. Using graph export to save your graph as a file allows you to put the entire graph creation process in a do file.
Complete Do File
The following is a complete do file for this article, including saving the graph as an .emf file:
capture log close
log using usegraphs.log, replace
clear all
set more off
use gss_sample
histogram educ, discrete percent
graph export educ_hist.emf, replace
log close
Last Revised: 7/2/2018